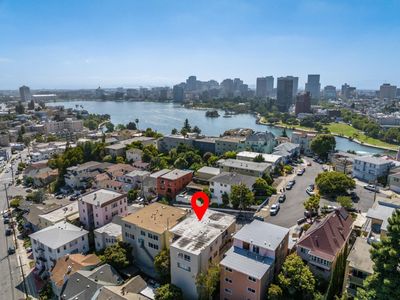
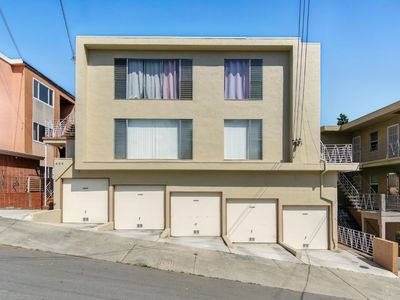
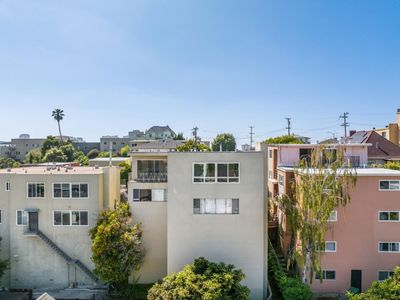
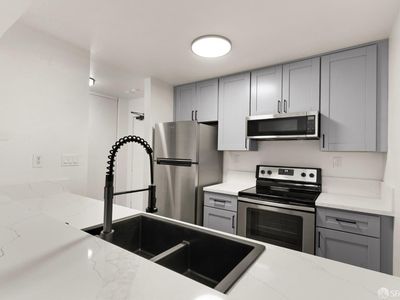
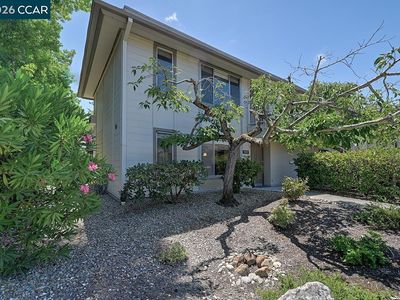
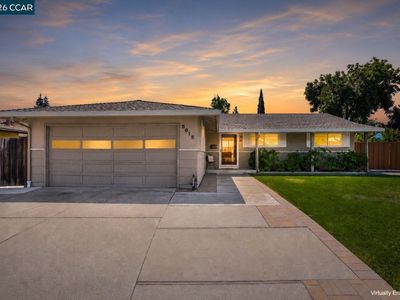
Capital StOaklandCA94610
INVESTMENT ANALYSIS
Investment Verdict
Appreciation PlayInvestors who prioritise long-run asset value over immediate income should consider Capital St, Oakland, CA, 94610 in Oakland. Rental yield 4.99%. At $1,315,000 with 4.99% gross yield, current distributions are modest, but the 5% appreciation rate projects $363,310 in new equity by year five, complemented by $12,111/yr in principal paydown. Ziffy Mortgage's DSCR loan (0.93) allows non-U.S. residents to acquire without W-2s or domestic credit. Total projected five-year cumulative return: $327,148.
| This Property | National Avg | |
|---|---|---|
| Gross Rental Yield | 5% | 6.2% |
| Monthly Cash Flow | $(2,665) | $180 |
National averages based on 2024–2025 U.S. residential rental market data. Content is user-generated and unverified.
DSCR Rental Loan Qualification
Qualifies using the property's rental income, not your personal income.
- ✓No W-2, pay stubs, or tax returns needed
- ✓Rental income qualifies you
- ✓Built for real estate investors
| Monthly Rental Income | $5,470 |
| Total Monthly Debt Service | $7,612 |
| DSCR Ratio | 0.72x |
Ziffy Mortgage typically prefers a DSCR of 1.0+, but in some cases you may qualify with a DSCR below 1. To explore if this deal qualifies for an investment mortgage, book time with your loan officer →
Estimates assume 6.0% rate / 30-yr fixed, 30% down, 1% tax, 0.5% insurance. Not a commitment to lend.
Multi Family
Built in 1960
4,051 sqft lot
$N/A/sqft
No HOA
Neighborhood Data
Neighborhood data shown for ZIP Code: 94610, Oakland, CA area.
Housing Distribution
Housing Statistics
| Category | Value |
|---|---|
| Total HU (Housing Units) | 15,703 (100%) |
| Owner Occupied HU | 5,410 (34.5%) |
| Renter Occupied HU | 9,352 (59.6%) |
| Vacant Housing Units | 941 ( 6.0%) |
| Median Home Value | $1,627,188 |
| Average Home Value | $1,535,032 |
Housing Distribution
Address Breakdown
Residential
16,235
Single Family
6,012
Multi-Family
10,223
Businesses
969


Nearby investment properties with comparable rents

Nearby investment properties with comparable prices

Ziffy AI Summary
A quick, investor-focused snapshot highlighting income strength, yield potential.
| Key metrics | Value |
|---|---|
| Price | $399,900 |
| Est. Rent | $3,200/mo |
| ROI | 18% |
- Attractive rent-to-price ratio for income stability
- Good fit for DSCR financing with healthy coverage
Multi Family
Built in 1960
4,051 sqft lot
$N/A/sqft
No HOA
Neighborhood Data
Neighborhood data shown for ZIP Code: 94610, Oakland, CA area.
Housing Distribution
Housing Statistics
| Category | Value |
|---|---|
| Total HU (Housing Units) | 15,703 (100%) |
| Owner Occupied HU | 5,410 (34.5%) |
| Renter Occupied HU | 9,352 (59.6%) |
| Vacant Housing Units | 941 ( 6.0%) |
| Median Home Value | $1,627,188 |
| Average Home Value | $1,535,032 |
Housing Distribution
Address Breakdown
Residential
16,235
Single Family
6,012
Multi-Family
10,223
Businesses
969
Nearby investment properties with comparable rents
Nearby investment properties with comparable prices
Listed by: Ismael Benhamida • Compass
Mls Name: MLSListings Inc
Mls Provider:
Mls ID: #ML82012249