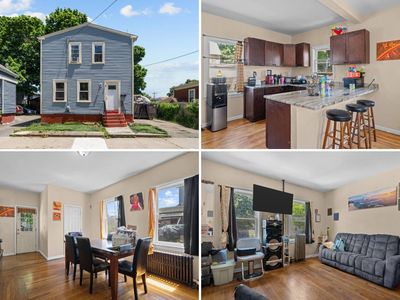
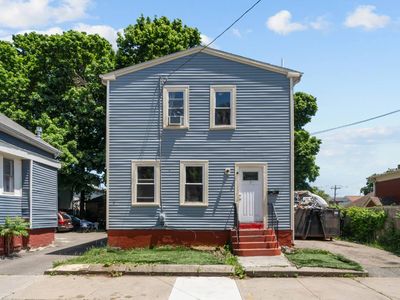
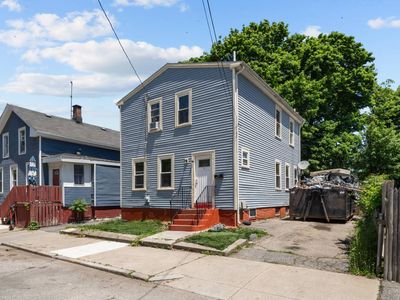
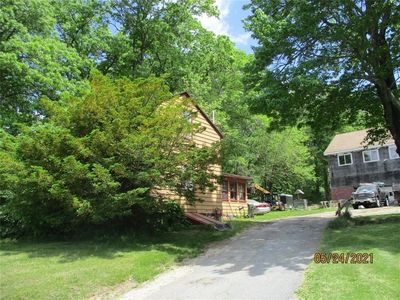
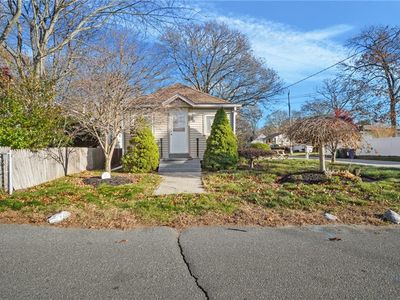
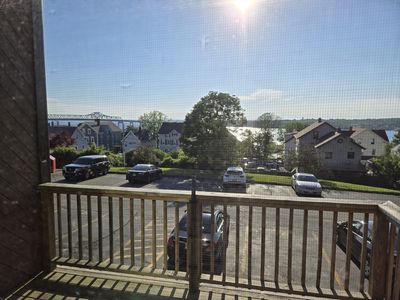
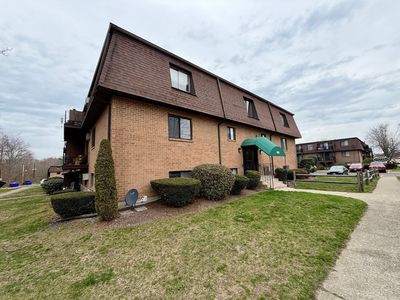
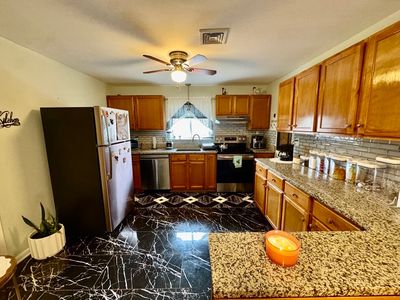
94 Burnside StProvidenceRI02905
INVESTMENT ANALYSIS
Investment Verdict
Solid IncomeThe 8.09% yield at 94 Burnside St, Providence, RI, 02905 in Providence is solid, but the $1,349/mo payment compresses net cash flow to $64/mo at $299,900. This is a tight-spread property, income covers debt, with little cushion. For investors who can optimise occupancy, the upside is real: 5% annual appreciation adds $82,857 by year five, and $2,762/yr in loan paydown builds equity. Ziffy Mortgage qualifies this via DSCR (1.50) without U.S. income documentation. Total projected return: $118,315.
| This Property | National Avg | |
|---|---|---|
| Gross Rental Yield | 8.1% | 6.2% |
| Monthly Cash Flow | $64 | $180 |
National averages based on 2024–2025 U.S. residential rental market data. Content is user-generated and unverified.
DSCR Rental Loan Qualification
Qualifies using the property's rental income, not your personal income.
- ✓No W-2, pay stubs, or tax returns needed
- ✓Rental income qualifies you
- ✓Built for real estate investors
| Monthly Rental Income | $2,022 |
| Total Monthly Debt Service | $1,838 |
| DSCR Ratio | 1.10x |
Ziffy Mortgage: Your DSCR most likely meets our 1.0+ requirement, so you'll most probably qualify for our standard DSCR investment loan program. To pre-qualify, book time with your loan officer →
Estimates assume 6.0% rate / 30-yr fixed, 30% down, 1% tax, 0.5% insurance. Not a commitment to lend.
Single Family
Built in 1922
3,800 sqft lot
$N/A/sqft
No HOA
Neighborhood Data
Neighborhood data shown for ZIP Code: 02905, Providence, RI area.
Housing Distribution
Housing Statistics
| Category | Value |
|---|---|
| Total HU (Housing Units) | 10,148 (100%) |
| Owner Occupied HU | 4,556 (44.9%) |
| Renter Occupied HU | 5,031 (49.6%) |
| Vacant Housing Units | 561 ( 5.5%) |
| Median Home Value | $384,429 |
| Average Home Value | $415,921 |
Housing Distribution
Address Breakdown
Residential
8,927
Single Family
8,066
Multi-Family
861
Businesses
857


Nearby investment properties with comparable rents
Nearby investment properties with comparable prices

Ziffy AI Summary
A quick, investor-focused snapshot highlighting income strength, yield potential.
| Key metrics | Value |
|---|---|
| Price | $399,900 |
| Est. Rent | $3,200/mo |
| ROI | 18% |
- Attractive rent-to-price ratio for income stability
- Good fit for DSCR financing with healthy coverage
Single Family
Built in 1922
3,800 sqft lot
$N/A/sqft
No HOA
Neighborhood Data
Neighborhood data shown for ZIP Code: 02905, Providence, RI area.
Housing Distribution
Housing Statistics
| Category | Value |
|---|---|
| Total HU (Housing Units) | 10,148 (100%) |
| Owner Occupied HU | 4,556 (44.9%) |
| Renter Occupied HU | 5,031 (49.6%) |
| Vacant Housing Units | 561 ( 5.5%) |
| Median Home Value | $384,429 |
| Average Home Value | $415,921 |
Housing Distribution
Address Breakdown
Residential
8,927
Single Family
8,066
Multi-Family
861
Businesses
857
Nearby investment properties with comparable rents
Nearby investment properties with comparable prices
Listed by: Rachel Sanville • Your Home Sold Guaranteed Realty, The Nathan Clark Team
Mls Name: My State MLS
Mls ID: #11792930