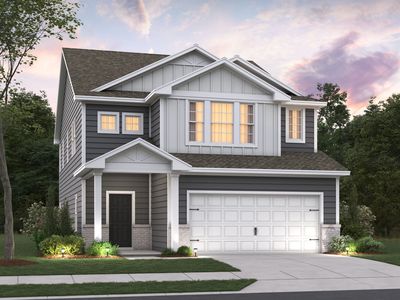
933 Watercourse CtNashvilleTN37214
INVESTMENT ANALYSIS
Investment Verdict
Appreciation PlayThe investment thesis at 933 Watercourse Ct, Nashville, TN, 37214 in Nashville is capital appreciation. Rental yield 0%. The 0% gross yield at $591,787 falls below cash-flow thresholds, but 5% annual value growth is forecast to deliver $163,500 in additional equity by year five, an equity gain that can outpace many higher-yield markets. Ziffy Mortgage finances appreciation-play assets via DSCR (0.00) without U.S. credit history; structure with a larger down payment to optimise coverage.
| This Property | National Avg | |
|---|---|---|
| Gross Rental Yield | 0% | 6.2% |
| Monthly Cash Flow | $0 | $180 |
National averages based on 2024–2025 U.S. residential rental market data. Content is user-generated and unverified.
Single Family
Built in N/A
N/A lot
$N/A/sqft
No HOA
Neighborhood Data
Neighborhood data shown for ZIP Code: 37214, Nashville, TN area.
Housing Distribution
Housing Statistics
| Category | Value |
|---|---|
| Total HU (Housing Units) | 15,746 (100%) |
| Owner Occupied HU | 8,410 (53.4%) |
| Renter Occupied HU | 6,157 (39.1%) |
| Vacant Housing Units | 1,179 ( 7.5%) |
| Median Home Value | $396,256 |
| Average Home Value | $472,010 |
Housing Distribution
Address Breakdown
Residential
15,364
Single Family
11,686
Multi-Family
3,678
Businesses
1,473


Nearby investment properties with comparable rents
No similar rental properties found nearby.
Nearby investment properties with comparable prices

Ziffy AI Summary
A quick, investor-focused snapshot highlighting income strength, yield potential.
| Key metrics | Value |
|---|---|
| Price | $399,900 |
| Est. Rent | $3,200/mo |
| ROI | 18% |
- Attractive rent-to-price ratio for income stability
- Good fit for DSCR financing with healthy coverage
Single Family
Built in N/A
N/A lot
$N/A/sqft
No HOA
Neighborhood Data
Neighborhood data shown for ZIP Code: 37214, Nashville, TN area.
Housing Distribution
Housing Statistics
| Category | Value |
|---|---|
| Total HU (Housing Units) | 15,746 (100%) |
| Owner Occupied HU | 8,410 (53.4%) |
| Renter Occupied HU | 6,157 (39.1%) |
| Vacant Housing Units | 1,179 ( 7.5%) |
| Median Home Value | $396,256 |
| Average Home Value | $472,010 |
Housing Distribution
Address Breakdown
Residential
15,364
Single Family
11,686
Multi-Family
3,678
Businesses
1,473
Nearby investment properties with comparable rents
No similar rental properties found nearby.
Nearby investment properties with comparable prices