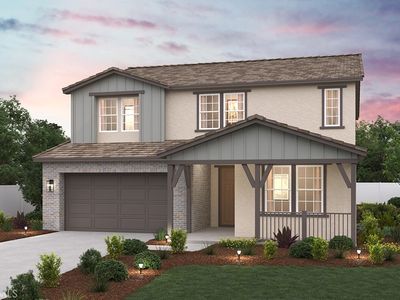
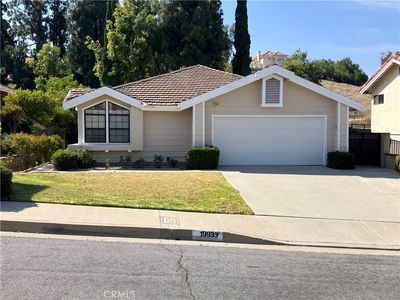
8513 Tamarack StChinoCA91708
INVESTMENT ANALYSIS
Investment Verdict
Appreciation Play8513 Tamarack St, Chino, CA, 91708 in Chino is priced for appreciation, not yield. Rental yield 0%. At $1,274,880 with a 0% gross yield, the monthly income is modest, but 5% annual price growth is projected to add $352,226 in value over five years, making equity the primary return driver. Ziffy Mortgage's DSCR mortgage (0.00) can still finance this property for non-U.S. residents; a 30–35% down payment typically produces the cleanest underwriting for appreciation-focused assets.
| This Property | National Avg | |
|---|---|---|
| Gross Rental Yield | 0% | 6.2% |
| Monthly Cash Flow | $0 | $180 |
National averages based on 2024–2025 U.S. residential rental market data. Content is user-generated and unverified.
Single Family
Built in N/A
N/A lot
$N/A/sqft
No HOA
Neighborhood Data
Neighborhood data shown for ZIP Code: 91708, Chino, CA area.
Housing Distribution
Housing Statistics
| Category | Value |
|---|---|
| Total HU (Housing Units) | 6,172 (100%) |
| Owner Occupied HU | 3,813 (61.8%) |
| Renter Occupied HU | 1,943 (31.5%) |
| Vacant Housing Units | 416 ( 6.7%) |
| Median Home Value | $658,636 |
| Average Home Value | $684,350 |
Housing Distribution
Address Breakdown
Residential
5,917
Single Family
5,668
Multi-Family
249
Businesses
642


Nearby investment properties with comparable rents
No similar rental properties found nearby.
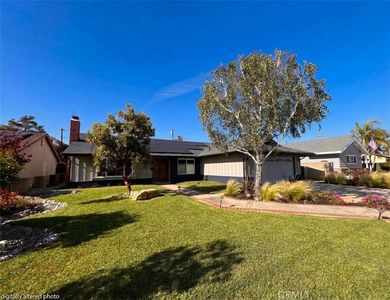
Nearby investment properties with comparable prices
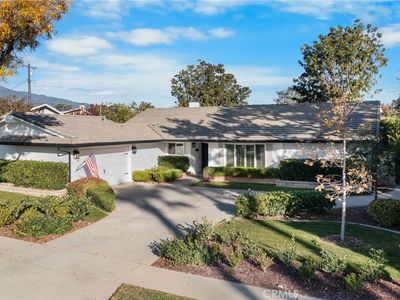
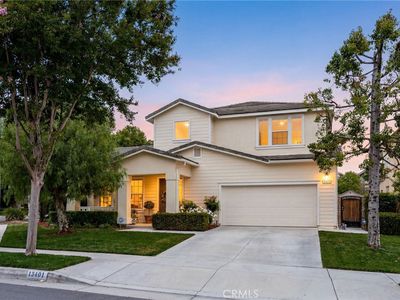

Ziffy AI Summary
A quick, investor-focused snapshot highlighting income strength, yield potential.
| Key metrics | Value |
|---|---|
| Price | $399,900 |
| Est. Rent | $3,200/mo |
| ROI | 18% |
- Attractive rent-to-price ratio for income stability
- Good fit for DSCR financing with healthy coverage
Single Family
Built in N/A
N/A lot
$N/A/sqft
No HOA
Neighborhood Data
Neighborhood data shown for ZIP Code: 91708, Chino, CA area.
Housing Distribution
Housing Statistics
| Category | Value |
|---|---|
| Total HU (Housing Units) | 6,172 (100%) |
| Owner Occupied HU | 3,813 (61.8%) |
| Renter Occupied HU | 1,943 (31.5%) |
| Vacant Housing Units | 416 ( 6.7%) |
| Median Home Value | $658,636 |
| Average Home Value | $684,350 |
Housing Distribution
Address Breakdown
Residential
5,917
Single Family
5,668
Multi-Family
249
Businesses
642
Nearby investment properties with comparable rents
No similar rental properties found nearby.
Nearby investment properties with comparable prices
Listed by: N/A • N/A
Mls Name: undefined
Mls ID: #CV26072565