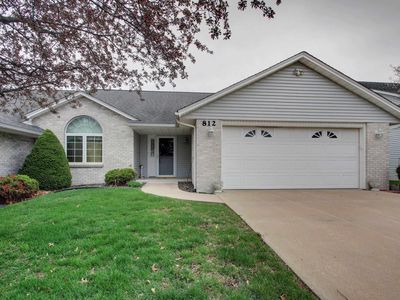
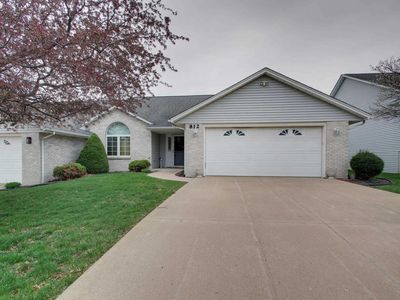
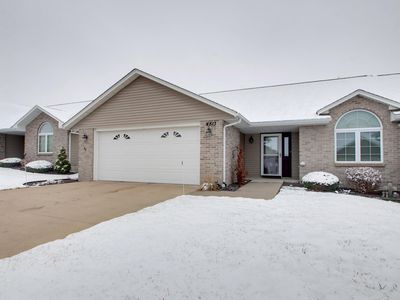
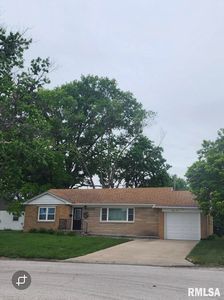
812 N 49th StQuincyIL62305
INVESTMENT ANALYSIS
Investment Verdict
Strong Cash FlowFew Quincy rentals match the income profile of 812 N 49th St, Quincy, IL, 62305. Listed at $229,900, gross rent is $2,753/mo and net cash flow is $1,103/mo, a 14.37% yield well above national averages. DSCR 2.66 means Ziffy Mortgage can approve your loan on the property's income alone, bypassing personal income verification. The 5% annual appreciation trend adds $63,517 by year five with $2,117/yr in annual principal reduction, projecting $162,457 in total cumulative return.
| This Property | National Avg | |
|---|---|---|
| Gross Rental Yield | 14.4% | 6.2% |
| Monthly Cash Flow | $1,103 | $180 |
National averages based on 2024–2025 U.S. residential rental market data. Content is user-generated and unverified.
DSCR Rental Loan Qualification
Qualifies using the property's rental income, not your personal income.
- ✓No W-2, pay stubs, or tax returns needed
- ✓Rental income qualifies you
- ✓Built for real estate investors
| Monthly Rental Income | $2,753 |
| Total Monthly Debt Service | $1,503 |
| DSCR Ratio | 1.83x |
Ziffy Mortgage: Your DSCR most likely meets our 1.0+ requirement, so you'll most probably qualify for our standard DSCR investment loan program. To pre-qualify, book time with your loan officer →
Estimates assume 6.0% rate / 30-yr fixed, 30% down, 1% tax, 0.5% insurance. Not a commitment to lend.
Condo
Built in N/A
2,613 sqft lot
$N/A/sqft
No HOA
Neighborhood Data
Neighborhood data shown for ZIP Code: 62305, Quincy, IL area.
Housing Distribution
Housing Statistics
| Category | Value |
|---|---|
| Total HU (Housing Units) | 8,511 (100%) |
| Owner Occupied HU | 6,567 (77.2%) |
| Renter Occupied HU | 1,393 (16.4%) |
| Vacant Housing Units | 551 ( 6.5%) |
| Median Home Value | $233,541 |
| Average Home Value | $257,294 |
Housing Distribution
Address Breakdown
Residential
8,078
Single Family
7,857
Multi-Family
221
Businesses
647


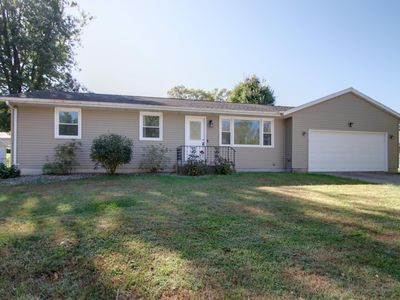
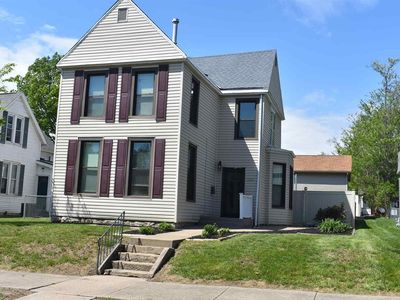
Nearby investment properties with comparable rents

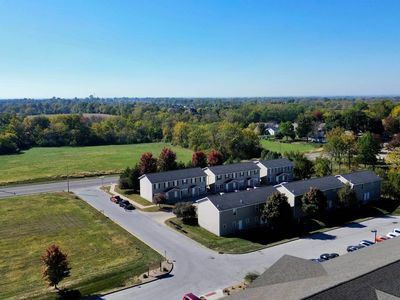
Nearby investment properties with comparable prices

Ziffy AI Summary
A quick, investor-focused snapshot highlighting income strength, yield potential.
| Key metrics | Value |
|---|---|
| Price | $399,900 |
| Est. Rent | $3,200/mo |
| ROI | 18% |
- Attractive rent-to-price ratio for income stability
- Good fit for DSCR financing with healthy coverage
Condo
Built in N/A
2,613 sqft lot
$N/A/sqft
No HOA
Neighborhood Data
Neighborhood data shown for ZIP Code: 62305, Quincy, IL area.
Housing Distribution
Housing Statistics
| Category | Value |
|---|---|
| Total HU (Housing Units) | 8,511 (100%) |
| Owner Occupied HU | 6,567 (77.2%) |
| Renter Occupied HU | 1,393 (16.4%) |
| Vacant Housing Units | 551 ( 6.5%) |
| Median Home Value | $233,541 |
| Average Home Value | $257,294 |
Housing Distribution
Address Breakdown
Residential
8,078
Single Family
7,857
Multi-Family
221
Businesses
647
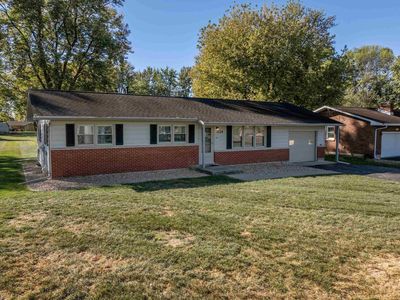
Nearby investment properties with comparable rents
Nearby investment properties with comparable prices