8-10 & Ct #5SalemMA01970
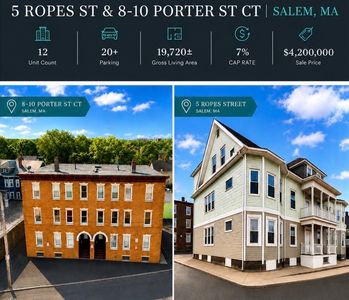
INVESTMENT ANALYSIS
Investment Verdict
Appreciation PlayInvestment property for sale in Salem at 8-10 & Ct #5, Salem, MA, 01970 projects strong ROI of 1.23%. Rental yield 1.51%. With 5% annual appreciation, the property builds $1,160,383 in value over five years. Equity growth combined delivers a projected five-year ROI of 19.54%, translating into $231,898 in total cumulative return on $1,186,500 invested capital. You can finance this property with Ziffy Mortgage’s DSCR loan, which leverages the property’s income for qualification rather than your personal income.
| This Property | National Avg | |
|---|---|---|
| Gross Rental Yield | 1.5% | 6.2% |
| Monthly Cash Flow | $(21,176) | $180 |
National averages based on 2024–2025 U.S. residential rental market data. Content is user-generated and unverified.
DSCR Rental Loan Qualification
Qualifies using the property's rental income, not your personal income.
- ✓No W-2, pay stubs, or tax returns needed
- ✓Rental income qualifies you
- ✓Built for real estate investors
| Monthly Rental Income | $5,296 |
| Total Monthly Debt Service | $24,801 |
| DSCR Ratio | 0.21x |
Ziffy Mortgage typically prefers a DSCR of 1.0+, but in some cases you may qualify with a DSCR below 1. To explore if this deal qualifies for an investment mortgage, book time with your loan officer →
Estimates assume 6.0% rate / 30-yr fixed, 30% down, 1% tax, 0.5% insurance. Not a commitment to lend.
Multi Family
Built in 1915
0.40 Acres lot
$N/A/sqft
No HOA
Neighborhood Data
Neighborhood data shown for ZIP Code: 01970, Salem, MA area.
Housing Distribution
Housing Statistics
| Category | Value |
|---|---|
| Total HU (Housing Units) | 20,846 (100%) |
| Owner Occupied HU | 10,263 (49.2%) |
| Renter Occupied HU | 9,561 (45.9%) |
| Vacant Housing Units | 1,022 ( 4.9%) |
| Median Home Value | $626,422 |
| Average Home Value | $665,116 |
Housing Distribution
Address Breakdown
Residential
18,571
Single Family
12,690
Multi-Family
5,881
Businesses
1,702


Nearby investment properties with comparable rents
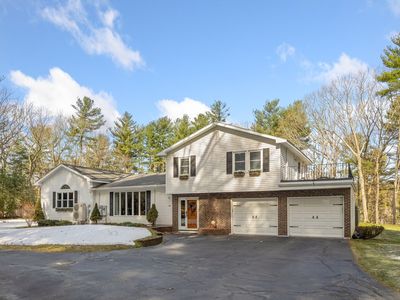
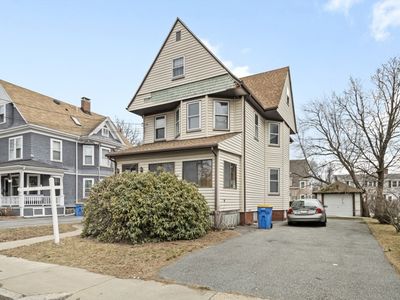
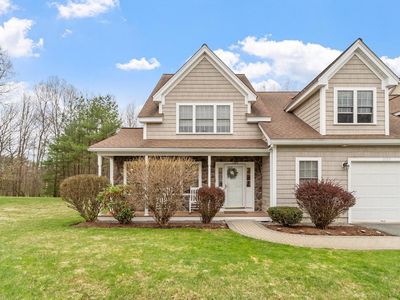
Nearby investment properties with comparable prices


Ziffy AI Summary
A quick, investor-focused snapshot highlighting income strength, yield potential.
| Key metrics | Value |
|---|---|
| Price | $399,900 |
| Est. Rent | $3,200/mo |
| ROI | 18% |
- Attractive rent-to-price ratio for income stability
- Good fit for DSCR financing with healthy coverage
Multi Family
Built in 1915
0.40 Acres lot
$N/A/sqft
No HOA
Neighborhood Data
Neighborhood data shown for ZIP Code: 01970, Salem, MA area.
Housing Distribution
Housing Statistics
| Category | Value |
|---|---|
| Total HU (Housing Units) | 20,846 (100%) |
| Owner Occupied HU | 10,263 (49.2%) |
| Renter Occupied HU | 9,561 (45.9%) |
| Vacant Housing Units | 1,022 ( 4.9%) |
| Median Home Value | $626,422 |
| Average Home Value | $665,116 |
Housing Distribution
Address Breakdown
Residential
18,571
Single Family
12,690
Multi-Family
5,881
Businesses
1,702
Nearby investment properties with comparable rents
Nearby investment properties with comparable prices
Listed by: N/A • N/A
Mls Name: MLS PIN
Mls ID: #73528048