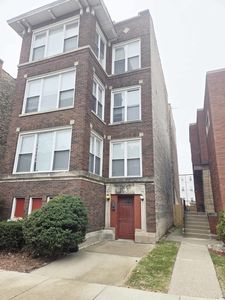
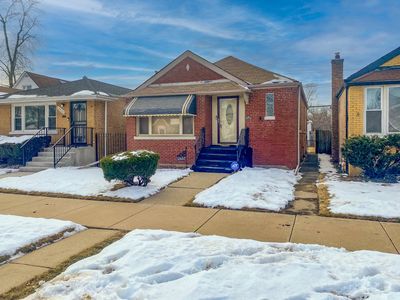
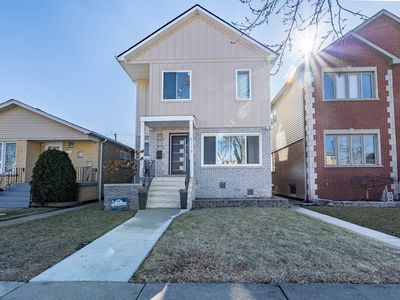
6730 S Merrill AveChicagoIL60649
INVESTMENT ANALYSIS
Investment Verdict
Appreciation PlayAt a 2.48% gross rental yield, 6730 S Merrill Ave, Chicago, IL, 60649 in Chicago is priced for capital growth, not immediate cash flow. The $730,000 purchase reflects market confidence in future value: at 5%/yr, the property is forecast to gain $201,686 by year five, with $6,723/yr in additional equity from loan paydown. Ziffy Mortgage's DSCR mortgage (0.46) qualifies for non-U.S. residents without personal income documents. Total five-year projected cumulative return: $50,305.
| This Property | National Avg | |
|---|---|---|
| Gross Rental Yield | 2.5% | 6.2% |
| Monthly Cash Flow | $(3,556) | $180 |
National averages based on 2024–2025 U.S. residential rental market data. Content is user-generated and unverified.
DSCR Rental Loan Qualification
Qualifies using the property's rental income, not your personal income.
- ✓No W-2, pay stubs, or tax returns needed
- ✓Rental income qualifies you
- ✓Built for real estate investors
| Monthly Rental Income | $1,507 |
| Total Monthly Debt Service | $4,773 |
| DSCR Ratio | 0.32x |
Ziffy Mortgage typically prefers a DSCR of 1.0+, but in some cases you may qualify with a DSCR below 1. To explore if this deal qualifies for an investment mortgage, book time with your loan officer →
Estimates assume 6.0% rate / 30-yr fixed, 30% down, 1% tax, 0.5% insurance. Not a commitment to lend.
Multi Family
Built in 1917
4,356 sqft lot
$N/A/sqft
No HOA
Neighborhood Data
Neighborhood data shown for ZIP Code: 60649, Chicago, IL area.
Housing Distribution
Housing Statistics
| Category | Value |
|---|---|
| Total HU (Housing Units) | 27,407 (100%) |
| Owner Occupied HU | 5,123 (18.7%) |
| Renter Occupied HU | 18,185 (66.4%) |
| Vacant Housing Units | 4,099 (15.0%) |
| Median Home Value | $262,345 |
| Average Home Value | $303,662 |
Housing Distribution
Address Breakdown
Residential
23,819
Single Family
4,497
Multi-Family
19,322
Businesses
773


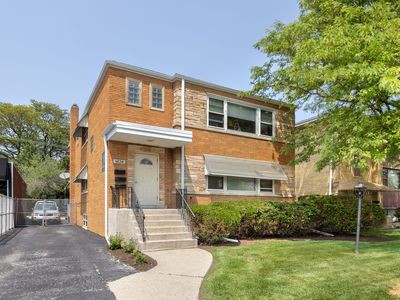
Nearby investment properties with comparable rents
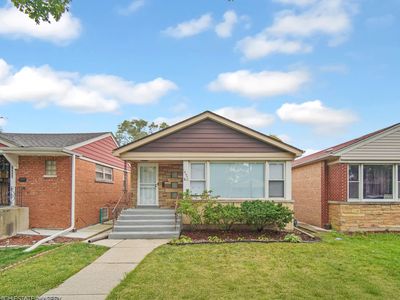
Nearby investment properties with comparable prices
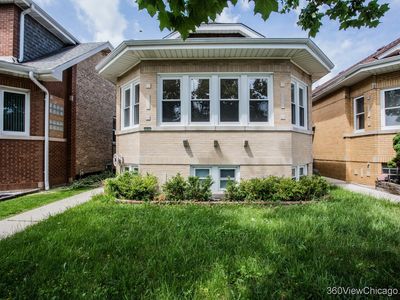


Ziffy AI Summary
A quick, investor-focused snapshot highlighting income strength, yield potential.
| Key metrics | Value |
|---|---|
| Price | $399,900 |
| Est. Rent | $3,200/mo |
| ROI | 18% |
- Attractive rent-to-price ratio for income stability
- Good fit for DSCR financing with healthy coverage
Multi Family
Built in 1917
4,356 sqft lot
$N/A/sqft
No HOA
Neighborhood Data
Neighborhood data shown for ZIP Code: 60649, Chicago, IL area.
Housing Distribution
Housing Statistics
| Category | Value |
|---|---|
| Total HU (Housing Units) | 27,407 (100%) |
| Owner Occupied HU | 5,123 (18.7%) |
| Renter Occupied HU | 18,185 (66.4%) |
| Vacant Housing Units | 4,099 (15.0%) |
| Median Home Value | $262,345 |
| Average Home Value | $303,662 |
Housing Distribution
Address Breakdown
Residential
23,819
Single Family
4,497
Multi-Family
19,322
Businesses
773
Nearby investment properties with comparable rents
Nearby investment properties with comparable prices