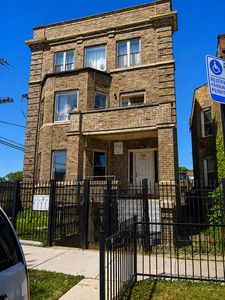
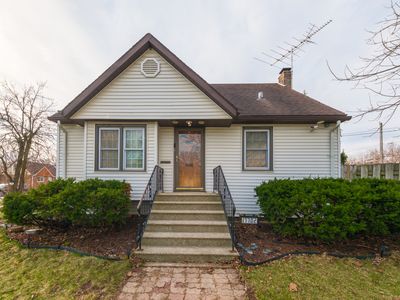
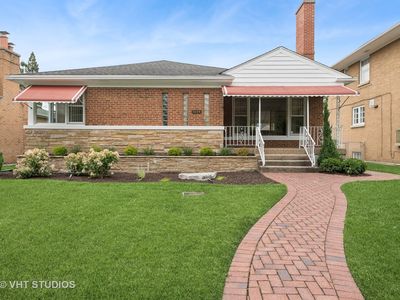
6244 S Langley AveChicagoIL60637

INVESTMENT ANALYSIS
Investment Verdict
Appreciation Play6244 S Langley Ave, Chicago, IL, 60637 in Chicago is priced for appreciation, not yield. Rental yield 2.77%. At $695,000 with a 2.77% gross yield, the monthly income is modest, but 5% annual price growth is projected to add $192,016 in value over five years, making equity the primary return driver. Ziffy Mortgage's DSCR mortgage (0.51) can still finance this property for non-U.S. residents; a 30–35% down payment typically produces the cleanest underwriting for appreciation-focused assets. Total projected cumulative return: $58,912.
| This Property | National Avg | |
|---|---|---|
| Gross Rental Yield | 2.8% | 6.2% |
| Monthly Cash Flow | $(3,216) | $180 |
National averages based on 2024–2025 U.S. residential rental market data. Content is user-generated and unverified.
DSCR Rental Loan Qualification
Qualifies using the property's rental income, not your personal income.
- ✓No W-2, pay stubs, or tax returns needed
- ✓Rental income qualifies you
- ✓Built for real estate investors
| Monthly Rental Income | $1,605 |
| Total Monthly Debt Service | $4,544 |
| DSCR Ratio | 0.35x |
Ziffy Mortgage typically prefers a DSCR of 1.0+, but in some cases you may qualify with a DSCR below 1. To explore if this deal qualifies for an investment mortgage, book time with your loan officer →
Estimates assume 6.0% rate / 30-yr fixed, 30% down, 1% tax, 0.5% insurance. Not a commitment to lend.
Multi Family
Built in 1910
4,182 sqft lot
$N/A/sqft
No HOA
Neighborhood Data
Neighborhood data shown for ZIP Code: 60637, Chicago, IL area.
Housing Distribution
Housing Statistics
| Category | Value |
|---|---|
| Total HU (Housing Units) | 26,309 (100%) |
| Owner Occupied HU | 5,112 (19.4%) |
| Renter Occupied HU | 17,180 (65.3%) |
| Vacant Housing Units | 4,017 (15.3%) |
| Median Home Value | $339,737 |
| Average Home Value | $433,374 |
Housing Distribution
Address Breakdown
Residential
22,517
Single Family
6,790
Multi-Family
15,727
Businesses
766


Nearby investment properties with comparable rents
Nearby investment properties with comparable prices

Ziffy AI Summary
A quick, investor-focused snapshot highlighting income strength, yield potential.
| Key metrics | Value |
|---|---|
| Price | $399,900 |
| Est. Rent | $3,200/mo |
| ROI | 18% |
- Attractive rent-to-price ratio for income stability
- Good fit for DSCR financing with healthy coverage
Multi Family
Built in 1910
4,182 sqft lot
$N/A/sqft
No HOA
Neighborhood Data
Neighborhood data shown for ZIP Code: 60637, Chicago, IL area.
Housing Distribution
Housing Statistics
| Category | Value |
|---|---|
| Total HU (Housing Units) | 26,309 (100%) |
| Owner Occupied HU | 5,112 (19.4%) |
| Renter Occupied HU | 17,180 (65.3%) |
| Vacant Housing Units | 4,017 (15.3%) |
| Median Home Value | $339,737 |
| Average Home Value | $433,374 |
Housing Distribution
Address Breakdown
Residential
22,517
Single Family
6,790
Multi-Family
15,727
Businesses
766
Nearby investment properties with comparable rents
Nearby investment properties with comparable prices