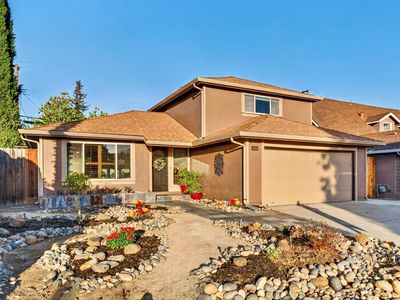
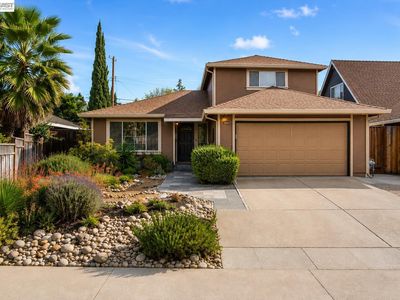
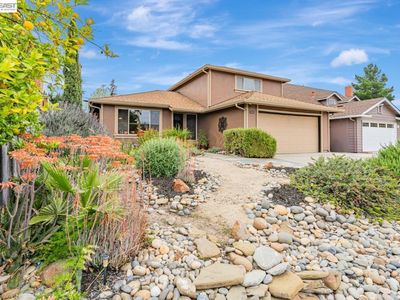
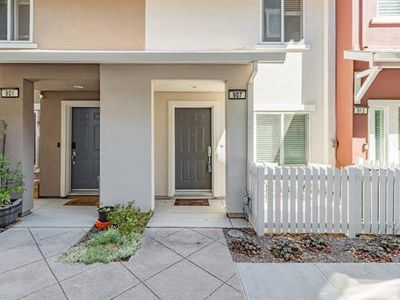
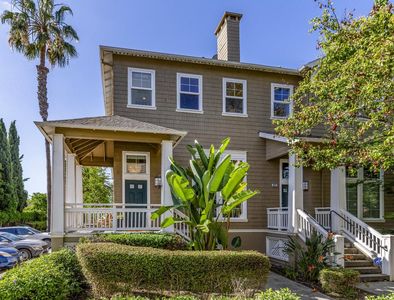
5684 Calpine DrSan JoseCA95123
INVESTMENT ANALYSIS
Investment Verdict
Appreciation PlayAt a 5.17% gross rental yield, 5684 Calpine Dr, San Jose, CA, 95123 in San Jose is priced for capital growth, not immediate cash flow. The $1,319,888 purchase reflects market confidence in future value: at 5%/yr, the property is forecast to gain $364,661 by year five, with $12,156/yr in additional equity from loan paydown. Ziffy Mortgage's DSCR mortgage (0.96) qualifies for non-U.S. residents without personal income documents. Total five-year projected cumulative return: $341,089.
| This Property | National Avg | |
|---|---|---|
| Gross Rental Yield | 5.2% | 6.2% |
| Monthly Cash Flow | $(2,477) | $180 |
National averages based on 2024–2025 U.S. residential rental market data. Content is user-generated and unverified.
DSCR Rental Loan Qualification
Qualifies using the property's rental income, not your personal income.
- ✓No W-2, pay stubs, or tax returns needed
- ✓Rental income qualifies you
- ✓Built for real estate investors
| Monthly Rental Income | $5,688 |
| Total Monthly Debt Service | $7,640 |
| DSCR Ratio | 0.74x |
Ziffy Mortgage typically prefers a DSCR of 1.0+, but in some cases you may qualify with a DSCR below 1. To explore if this deal qualifies for an investment mortgage, book time with your loan officer →
Estimates assume 6.0% rate / 30-yr fixed, 30% down, 1% tax, 0.5% insurance. Not a commitment to lend.
Single Family
Built in 1963
5,227 sqft lot
$N/A/sqft
No HOA
Neighborhood Data
Neighborhood data shown for ZIP Code: 95123, San Jose, CA area.
Housing Distribution
Housing Statistics
| Category | Value |
|---|---|
| Total HU (Housing Units) | 24,587 (100%) |
| Owner Occupied HU | 14,216 (57.8%) |
| Renter Occupied HU | 9,594 (39.0%) |
| Vacant Housing Units | 777 ( 3.2%) |
| Median Home Value | $1,169,061 |
| Average Home Value | $1,179,482 |
Housing Distribution
Address Breakdown
Residential
24,862
Single Family
20,176
Multi-Family
4,686
Businesses
950


Nearby investment properties with comparable rents
Nearby investment properties with comparable prices


Ziffy AI Summary
A quick, investor-focused snapshot highlighting income strength, yield potential.
| Key metrics | Value |
|---|---|
| Price | $399,900 |
| Est. Rent | $3,200/mo |
| ROI | 18% |
- Attractive rent-to-price ratio for income stability
- Good fit for DSCR financing with healthy coverage
Single Family
Built in 1963
5,227 sqft lot
$N/A/sqft
No HOA
Neighborhood Data
Neighborhood data shown for ZIP Code: 95123, San Jose, CA area.
Housing Distribution
Housing Statistics
| Category | Value |
|---|---|
| Total HU (Housing Units) | 24,587 (100%) |
| Owner Occupied HU | 14,216 (57.8%) |
| Renter Occupied HU | 9,594 (39.0%) |
| Vacant Housing Units | 777 ( 3.2%) |
| Median Home Value | $1,169,061 |
| Average Home Value | $1,179,482 |
Housing Distribution
Address Breakdown
Residential
24,862
Single Family
20,176
Multi-Family
4,686
Businesses
950
Nearby investment properties with comparable rents
Nearby investment properties with comparable prices
Listed by: Michael Tessaro • Intero Real Estate Services
Mls Name: Bay East AOR
Mls Provider:
Mls ID: #41135896
Disclaimer: Bay East 2026, CCAR 2026, bridgeMLS 2026. Information Deemed Reliable but not Guaranteed. This information is being provided by the Bay East MLS, or CCAR MLS, or bridgeMLS. The listings presented here may or may not be listed by the Broker/Agent operating this website. This information is intended for the personal use of consumers and may not be used or any purpose other than to identify prospective properties consumers may be interested in purchasing. Data last updated at 2026-06-14 22:27:40 PDT.