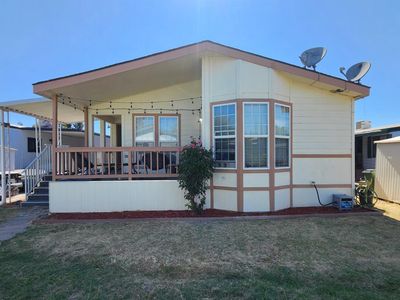
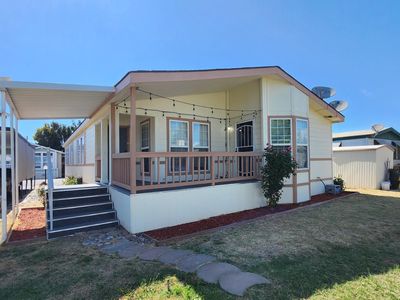
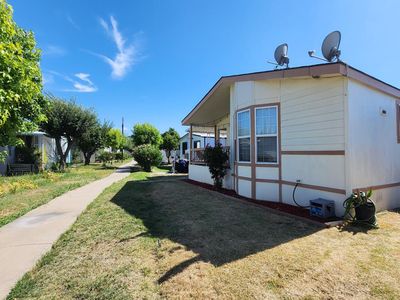
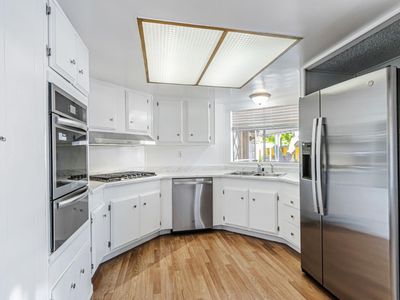
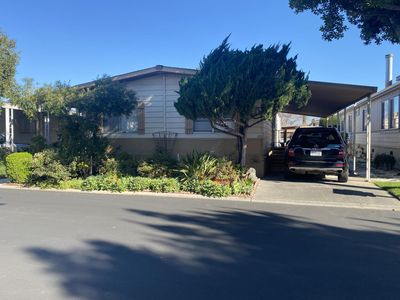
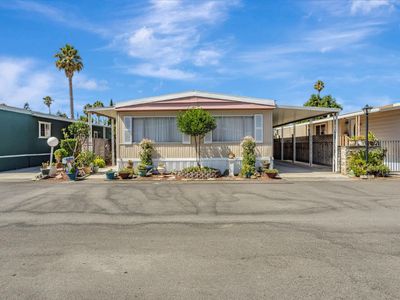
5450 Monterey Rd #142San JoseCA95111
INVESTMENT ANALYSIS
Investment Verdict
Steady Equity BuilderInvestors who treat current yield as secondary to long-run equity growth will find 5450 Monterey Rd #142, San Jose, CA, 95111 in San Jose worth modelling. At $409,000 with a 7.5% gross yield, the $2,556/mo rent leaves $26/mo after the $1,839/mo payment, sufficient to cover costs, modest in distribution. Ziffy Mortgage's 1.39 DSCR loan can finance the acquisition without personal income documentation. Appreciation of 5%/yr is projected to add $112,999 by year five; $3,767/yr in principal reduction adds further equity. Total projected return: $156,757.
| This Property | National Avg | |
|---|---|---|
| Gross Rental Yield | 7.5% | 6.2% |
| Monthly Cash Flow | $26 | $180 |
National averages based on 2024–2025 U.S. residential rental market data. Content is user-generated and unverified.
DSCR Rental Loan Qualification
Qualifies using the property's rental income, not your personal income.
- ✓No W-2, pay stubs, or tax returns needed
- ✓Rental income qualifies you
- ✓Built for real estate investors
| Monthly Rental Income | $2,556 |
| Total Monthly Debt Service | $2,367 |
| DSCR Ratio | 1.08x |
Ziffy Mortgage: Your DSCR most likely meets our 1.0+ requirement, so you'll most probably qualify for our standard DSCR investment loan program. To pre-qualify, book time with your loan officer →
Estimates assume 6.0% rate / 30-yr fixed, 30% down, 1% tax, 0.5% insurance. Not a commitment to lend.
Manufactured
Built in 1998
N/A lot
$N/A/sqft
No HOA
Neighborhood Data
Neighborhood data shown for ZIP Code: 95111, San Jose, CA area.
Housing Distribution
Housing Statistics
| Category | Value |
|---|---|
| Total HU (Housing Units) | 16,643 (100%) |
| Owner Occupied HU | 8,898 (53.5%) |
| Renter Occupied HU | 7,339 (44.1%) |
| Vacant Housing Units | 406 ( 2.4%) |
| Median Home Value | $857,011 |
| Average Home Value | $974,302 |
Housing Distribution
Address Breakdown
Residential
16,177
Single Family
14,754
Multi-Family
1,423
Businesses
703


Nearby investment properties with comparable rents
Nearby investment properties with comparable prices

Ziffy AI Summary
A quick, investor-focused snapshot highlighting income strength, yield potential.
| Key metrics | Value |
|---|---|
| Price | $399,900 |
| Est. Rent | $3,200/mo |
| ROI | 18% |
- Attractive rent-to-price ratio for income stability
- Good fit for DSCR financing with healthy coverage
Manufactured
Built in 1998
N/A lot
$N/A/sqft
No HOA
Neighborhood Data
Neighborhood data shown for ZIP Code: 95111, San Jose, CA area.
Housing Distribution
Housing Statistics
| Category | Value |
|---|---|
| Total HU (Housing Units) | 16,643 (100%) |
| Owner Occupied HU | 8,898 (53.5%) |
| Renter Occupied HU | 7,339 (44.1%) |
| Vacant Housing Units | 406 ( 2.4%) |
| Median Home Value | $857,011 |
| Average Home Value | $974,302 |
Housing Distribution
Address Breakdown
Residential
16,177
Single Family
14,754
Multi-Family
1,423
Businesses
703
Nearby investment properties with comparable rents
Nearby investment properties with comparable prices
Listed by: N/A • N/A
Mls Name: MLSListings Inc
Mls ID: #ML82048902