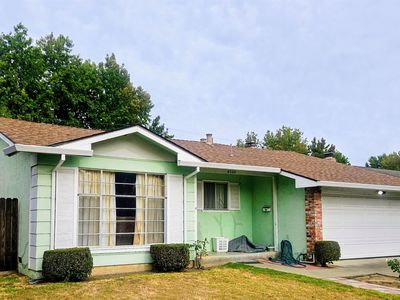
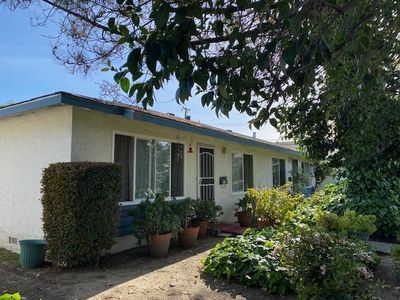
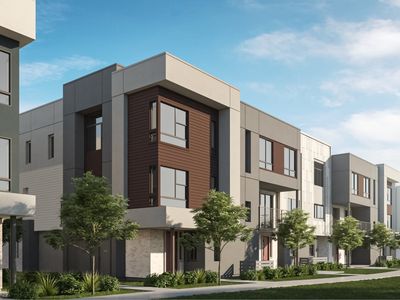
4265 Tehama AveFremontCA94538
INVESTMENT ANALYSIS
Investment Verdict
Appreciation PlayInvestors who prioritise long-run asset value over immediate income should consider 4265 Tehama Ave, Fremont, CA, 94538 in Fremont. Rental yield 4.48%. At $1,388,831 with 4.48% gross yield, current distributions are modest, but the 5% appreciation rate projects $383,708 in new equity by year five, complemented by $12,791/yr in principal paydown. Ziffy Mortgage's DSCR loan (0.83) allows non-U.S. residents to acquire without W-2s or domestic credit. Total projected five-year cumulative return: $307,688.
| This Property | National Avg | |
|---|---|---|
| Gross Rental Yield | 4.5% | 6.2% |
| Monthly Cash Flow | $(3,403) | $180 |
National averages based on 2024–2025 U.S. residential rental market data. Content is user-generated and unverified.
DSCR Rental Loan Qualification
Qualifies using the property's rental income, not your personal income.
- ✓No W-2, pay stubs, or tax returns needed
- ✓Rental income qualifies you
- ✓Built for real estate investors
| Monthly Rental Income | $5,189 |
| Total Monthly Debt Service | $8,039 |
| DSCR Ratio | 0.65x |
Ziffy Mortgage typically prefers a DSCR of 1.0+, but in some cases you may qualify with a DSCR below 1. To explore if this deal qualifies for an investment mortgage, book time with your loan officer →
Estimates assume 6.0% rate / 30-yr fixed, 30% down, 1% tax, 0.5% insurance. Not a commitment to lend.
Single Family
Built in 1963
6,098 sqft lot
$N/A/sqft
No HOA
Neighborhood Data
Neighborhood data shown for ZIP Code: 94538, Fremont, CA area.
Housing Distribution
Housing Statistics
| Category | Value |
|---|---|
| Total HU (Housing Units) | 24,484 (100%) |
| Owner Occupied HU | 10,624 (43.4%) |
| Renter Occupied HU | 12,116 (49.5%) |
| Vacant Housing Units | 1,744 ( 7.1%) |
| Median Home Value | $1,190,285 |
| Average Home Value | $1,209,831 |
Housing Distribution
Address Breakdown
Residential
23,798
Single Family
15,392
Multi-Family
8,406
Businesses
3,823


Nearby investment properties with comparable rents
Nearby investment properties with comparable prices

Ziffy AI Summary
A quick, investor-focused snapshot highlighting income strength, yield potential.
| Key metrics | Value |
|---|---|
| Price | $399,900 |
| Est. Rent | $3,200/mo |
| ROI | 18% |
- Attractive rent-to-price ratio for income stability
- Good fit for DSCR financing with healthy coverage
Single Family
Built in 1963
6,098 sqft lot
$N/A/sqft
No HOA
Neighborhood Data
Neighborhood data shown for ZIP Code: 94538, Fremont, CA area.
Housing Distribution
Housing Statistics
| Category | Value |
|---|---|
| Total HU (Housing Units) | 24,484 (100%) |
| Owner Occupied HU | 10,624 (43.4%) |
| Renter Occupied HU | 12,116 (49.5%) |
| Vacant Housing Units | 1,744 ( 7.1%) |
| Median Home Value | $1,190,285 |
| Average Home Value | $1,209,831 |
Housing Distribution
Address Breakdown
Residential
23,798
Single Family
15,392
Multi-Family
8,406
Businesses
3,823
Nearby investment properties with comparable rents
Nearby investment properties with comparable prices
Listed by: N/A • N/A
Mls Name: Bay East AOR
Mls ID: #41129051