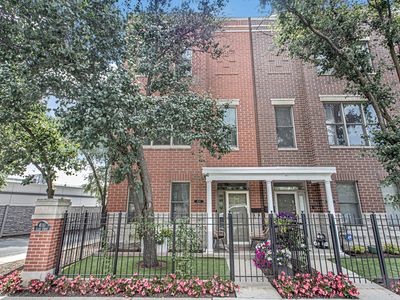
4012 N Clark StChicagoIL60613
INVESTMENT ANALYSIS
Investment Verdict
Strong Cash FlowStrong cash flow defines 4012 N Clark St, Chicago, IL, 60613 in Chicago: $6,191/mo in rent, $884/mo net, 10.25% gross yield, all on a $725,000 acquisition. The 1.90 coverage ratio comfortably clears Ziffy Mortgage's threshold, enabling foreign-national buyers to close without U.S. credit documentation. Over five years, 5% appreciation adds $200,304 in value, and $6,677/yr in principal paydown steadily builds equity. Projected total cumulative return: $352,059.
| This Property | National Avg | |
|---|---|---|
| Gross Rental Yield | 10.3% | 6.2% |
| Monthly Cash Flow | $884 | $180 |
National averages based on 2024–2025 U.S. residential rental market data. Content is user-generated and unverified.
DSCR Rental Loan Qualification
Qualifies using the property's rental income, not your personal income.
- ✓No W-2, pay stubs, or tax returns needed
- ✓Rental income qualifies you
- ✓Built for real estate investors
| Monthly Rental Income | $6,191 |
| Total Monthly Debt Service | $4,740 |
| DSCR Ratio | 1.31x |
Ziffy Mortgage: Your DSCR most likely meets our 1.0+ requirement, so you'll most probably qualify for our standard DSCR investment loan program. To pre-qualify, book time with your loan officer →
Estimates assume 6.0% rate / 30-yr fixed, 30% down, 1% tax, 0.5% insurance. Not a commitment to lend.
Townhouse
Built in 2001
N/A lot
$N/A/sqft
No HOA
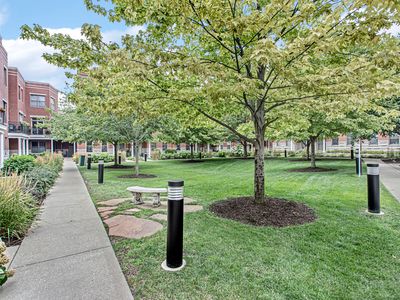
Neighborhood Data
Neighborhood data shown for ZIP Code: 60613, Chicago, IL area.
Housing Distribution
Housing Statistics
| Category | Value |
|---|---|
| Total HU (Housing Units) | 30,966 (100%) |
| Owner Occupied HU | 10,909 (35.2%) |
| Renter Occupied HU | 17,609 (56.9%) |
| Vacant Housing Units | 2,448 ( 7.9%) |
| Median Home Value | $439,006 |
| Average Home Value | $567,627 |
Housing Distribution
Address Breakdown
Residential
30,817
Single Family
3,868
Multi-Family
26,949
Businesses
1,388


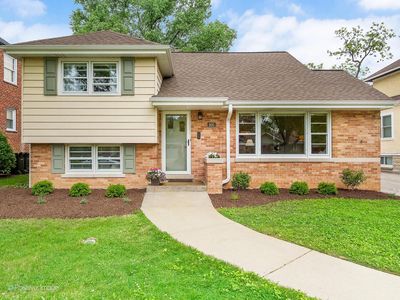
Nearby investment properties with comparable rents

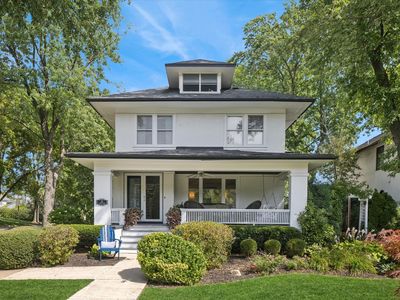

Nearby investment properties with comparable prices

Ziffy AI Summary
A quick, investor-focused snapshot highlighting income strength, yield potential.
| Key metrics | Value |
|---|---|
| Price | $399,900 |
| Est. Rent | $3,200/mo |
| ROI | 18% |
- Attractive rent-to-price ratio for income stability
- Good fit for DSCR financing with healthy coverage
Townhouse
Built in 2001
N/A lot
$N/A/sqft
No HOA
Neighborhood Data
Neighborhood data shown for ZIP Code: 60613, Chicago, IL area.
Housing Distribution
Housing Statistics
| Category | Value |
|---|---|
| Total HU (Housing Units) | 30,966 (100%) |
| Owner Occupied HU | 10,909 (35.2%) |
| Renter Occupied HU | 17,609 (56.9%) |
| Vacant Housing Units | 2,448 ( 7.9%) |
| Median Home Value | $439,006 |
| Average Home Value | $567,627 |
Housing Distribution
Address Breakdown
Residential
30,817
Single Family
3,868
Multi-Family
26,949
Businesses
1,388
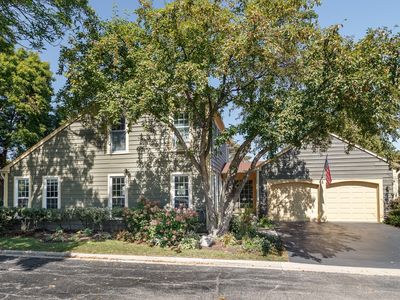
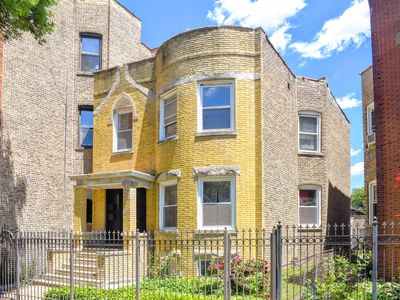
Nearby investment properties with comparable rents
Nearby investment properties with comparable prices