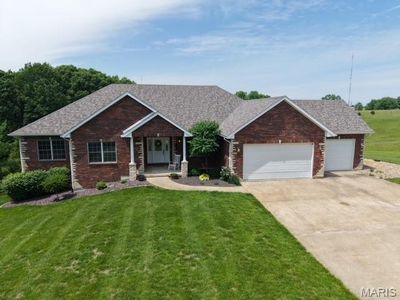
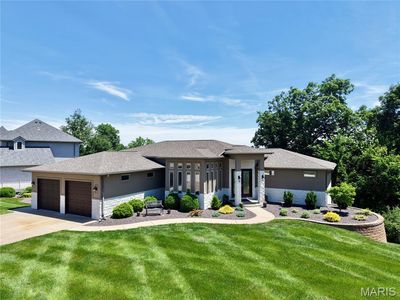
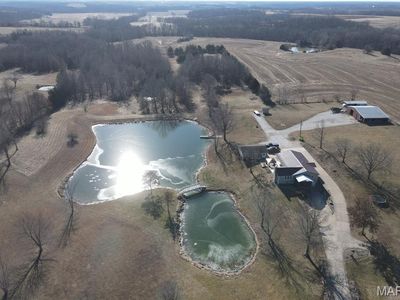
3501 N 72nd StQuincyIL62305
INVESTMENT ANALYSIS
Investment Verdict
Solid IncomeThe income profile at 3501 N 72nd St, Quincy, IL, 62305 in Quincy is straightforward: $525,000 in, $4,060/mo in rent, $418/mo out after debt service. The 9.28% gross yield and 1.72 DSCR make this exactly the kind of asset Ziffy Mortgage finances for non-U.S. residents without income documentation. Appreciation at 5%/yr adds $145,048 by year five. With $4,835/yr in principal equity, the total cumulative return is projected at $227,728.
| This Property | National Avg | |
|---|---|---|
| Gross Rental Yield | 9.3% | 6.2% |
| Monthly Cash Flow | $418 | $180 |
National averages based on 2024–2025 U.S. residential rental market data. Content is user-generated and unverified.
DSCR Rental Loan Qualification
Qualifies using the property's rental income, not your personal income.
- ✓No W-2, pay stubs, or tax returns needed
- ✓Rental income qualifies you
- ✓Built for real estate investors
| Monthly Rental Income | $4,060 |
| Total Monthly Debt Service | $3,433 |
| DSCR Ratio | 1.18x |
Ziffy Mortgage: Your DSCR most likely meets our 1.0+ requirement, so you'll most probably qualify for our standard DSCR investment loan program. To pre-qualify, book time with your loan officer →
Estimates assume 6.0% rate / 30-yr fixed, 30% down, 1% tax, 0.5% insurance. Not a commitment to lend.
Single Family
Built in 2006
3.90 Acres lot
$N/A/sqft
No HOA
Neighborhood Data
Neighborhood data shown for ZIP Code: 62305, Quincy, IL area.
Housing Distribution
Housing Statistics
| Category | Value |
|---|---|
| Total HU (Housing Units) | 8,511 (100%) |
| Owner Occupied HU | 6,567 (77.2%) |
| Renter Occupied HU | 1,393 (16.4%) |
| Vacant Housing Units | 551 ( 6.5%) |
| Median Home Value | $233,541 |
| Average Home Value | $257,294 |
Housing Distribution
Address Breakdown
Residential
8,078
Single Family
7,857
Multi-Family
221
Businesses
647


Nearby investment properties with comparable rents
Nearby investment properties with comparable prices

Ziffy AI Summary
A quick, investor-focused snapshot highlighting income strength, yield potential.
| Key metrics | Value |
|---|---|
| Price | $399,900 |
| Est. Rent | $3,200/mo |
| ROI | 18% |
- Attractive rent-to-price ratio for income stability
- Good fit for DSCR financing with healthy coverage
Single Family
Built in 2006
3.90 Acres lot
$N/A/sqft
No HOA
Neighborhood Data
Neighborhood data shown for ZIP Code: 62305, Quincy, IL area.
Housing Distribution
Housing Statistics
| Category | Value |
|---|---|
| Total HU (Housing Units) | 8,511 (100%) |
| Owner Occupied HU | 6,567 (77.2%) |
| Renter Occupied HU | 1,393 (16.4%) |
| Vacant Housing Units | 551 ( 6.5%) |
| Median Home Value | $233,541 |
| Average Home Value | $257,294 |
Housing Distribution
Address Breakdown
Residential
8,078
Single Family
7,857
Multi-Family
221
Businesses
647
Nearby investment properties with comparable rents
Nearby investment properties with comparable prices