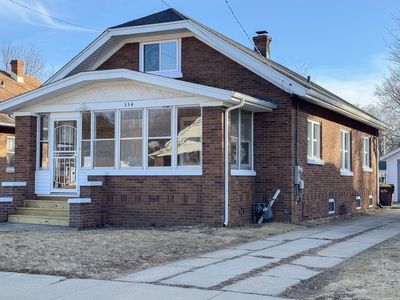
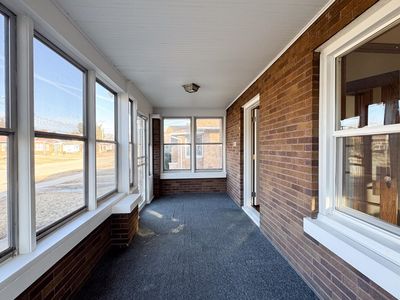
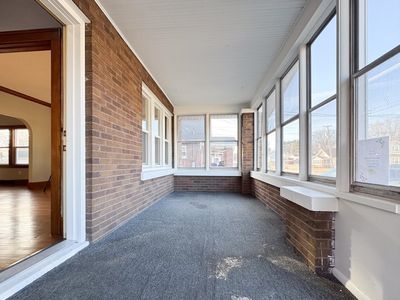
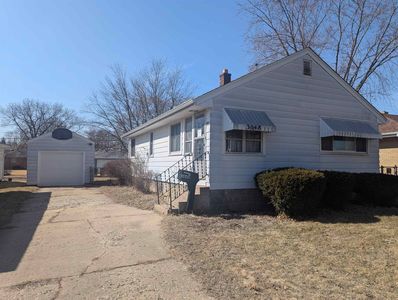
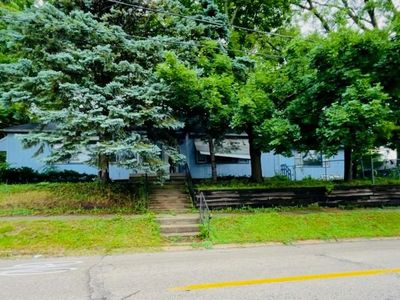
334 Ogilby RdRockfordIL61102
INVESTMENT ANALYSIS
Investment Verdict
Strong Cash FlowThe yield at 334 Ogilby Rd, Rockford, IL, 61102 in Rockford speaks for itself: 15.53% gross on a $117,000 price, generating $1,514/mo in rent and $703/mo in net income after the $526/mo debt service. DSCR 2.88, a wide margin that supports Ziffy Mortgage's DSCR loan without any personal income check. Annual cash flow of $8,434 stacks alongside $32,325 in projected five-year appreciation and $1,078/yr in principal reduction. Projected total cumulative return: $90,008.
| This Property | National Avg | |
|---|---|---|
| Gross Rental Yield | 15.5% | 6.2% |
| Monthly Cash Flow | $703 | $180 |
National averages based on 2024–2025 U.S. residential rental market data. Content is user-generated and unverified.
DSCR Rental Loan Qualification
Qualifies using the property's rental income, not your personal income.
- ✓No W-2, pay stubs, or tax returns needed
- ✓Rental income qualifies you
- ✓Built for real estate investors
| Monthly Rental Income | $1,514 |
| Total Monthly Debt Service | $765 |
| DSCR Ratio | 1.98x |
Ziffy Mortgage: Your DSCR most likely meets our 1.0+ requirement, so you'll most probably qualify for our standard DSCR investment loan program. To pre-qualify, book time with your loan officer →
Estimates assume 6.0% rate / 30-yr fixed, 30% down, 1% tax, 0.5% insurance. Not a commitment to lend.
Single Family
Built in 1930
8,276 sqft lot
$N/A/sqft
No HOA
Neighborhood Data
Neighborhood data shown for ZIP Code: 61102, Rockford, IL area.
Housing Distribution
Housing Statistics
| Category | Value |
|---|---|
| Total HU (Housing Units) | 6,973 (100%) |
| Owner Occupied HU | 3,994 (57.3%) |
| Renter Occupied HU | 2,158 (30.9%) |
| Vacant Housing Units | 821 (11.8%) |
| Median Home Value | $125,702 |
| Average Home Value | $147,453 |
Housing Distribution
Address Breakdown
Residential
6,331
Single Family
6,321
Multi-Family
10
Businesses
288


Nearby investment properties with comparable rents
Nearby investment properties with comparable prices

Ziffy AI Summary
A quick, investor-focused snapshot highlighting income strength, yield potential.
| Key metrics | Value |
|---|---|
| Price | $399,900 |
| Est. Rent | $3,200/mo |
| ROI | 18% |
- Attractive rent-to-price ratio for income stability
- Good fit for DSCR financing with healthy coverage
Single Family
Built in 1930
8,276 sqft lot
$N/A/sqft
No HOA
Neighborhood Data
Neighborhood data shown for ZIP Code: 61102, Rockford, IL area.
Housing Distribution
Housing Statistics
| Category | Value |
|---|---|
| Total HU (Housing Units) | 6,973 (100%) |
| Owner Occupied HU | 3,994 (57.3%) |
| Renter Occupied HU | 2,158 (30.9%) |
| Vacant Housing Units | 821 (11.8%) |
| Median Home Value | $125,702 |
| Average Home Value | $147,453 |
Housing Distribution
Address Breakdown
Residential
6,331
Single Family
6,321
Multi-Family
10
Businesses
288
Nearby investment properties with comparable rents
Nearby investment properties with comparable prices