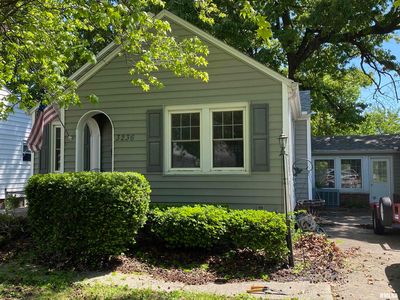
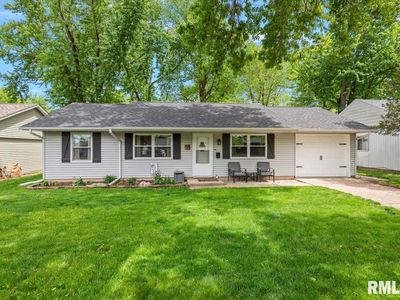
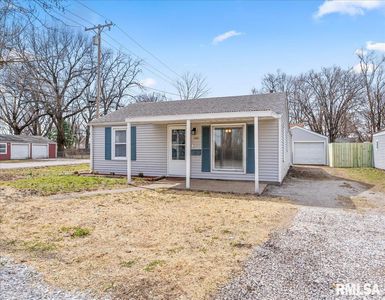
3236 S 5th StSouthern ViewIL62703
INVESTMENT ANALYSIS
Investment Verdict
Strong Cash FlowNot flashy, but dependably profitable, 3236 S 5th St, Southern View, IL, 62703 in Southern View is listed at $154,900 and delivers $1,500/mo in rent and $426/mo in net monthly cash flow. The 11.62% yield and 2.15 DSCR provide the underwriting comfort Ziffy Mortgage needs to approve a DSCR loan without W-2 or tax-return documentation. Projected 5% annual appreciation adds $42,796 over five years, and $1,427/yr in principal reduction supplements cash return. Total projected cumulative return: $86,601.
| This Property | National Avg | |
|---|---|---|
| Gross Rental Yield | 11.6% | 6.2% |
| Monthly Cash Flow | $426 | $180 |
National averages based on 2024–2025 U.S. residential rental market data. Content is user-generated and unverified.
DSCR Rental Loan Qualification
Qualifies using the property's rental income, not your personal income.
- ✓No W-2, pay stubs, or tax returns needed
- ✓Rental income qualifies you
- ✓Built for real estate investors
| Monthly Rental Income | $1,500 |
| Total Monthly Debt Service | $1,013 |
| DSCR Ratio | 1.48x |
Ziffy Mortgage: Your DSCR most likely meets our 1.0+ requirement, so you'll most probably qualify for our standard DSCR investment loan program. To pre-qualify, book time with your loan officer →
Estimates assume 6.0% rate / 30-yr fixed, 30% down, 1% tax, 0.5% insurance. Not a commitment to lend.
Single Family
Built in N/A
0.29 Acres lot
$N/A/sqft
No HOA
Neighborhood Data
Neighborhood data shown for ZIP Code: 62703, Springfield, IL area.
Housing Distribution
Housing Statistics
| Category | Value |
|---|---|
| Total HU (Housing Units) | 13,796 (100%) |
| Owner Occupied HU | 6,719 (48.7%) |
| Renter Occupied HU | 5,111 (37.0%) |
| Vacant Housing Units | 1,966 (14.3%) |
| Median Home Value | $106,497 |
| Average Home Value | $153,646 |
Housing Distribution
Address Breakdown
Residential
12,927
Single Family
11,565
Multi-Family
1,362
Businesses
1,237


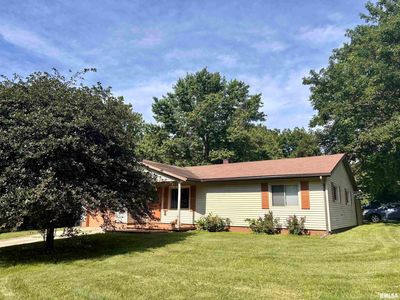
Nearby investment properties with comparable rents
Nearby investment properties with comparable prices

Ziffy AI Summary
A quick, investor-focused snapshot highlighting income strength, yield potential.
| Key metrics | Value |
|---|---|
| Price | $399,900 |
| Est. Rent | $3,200/mo |
| ROI | 18% |
- Attractive rent-to-price ratio for income stability
- Good fit for DSCR financing with healthy coverage
Single Family
Built in N/A
0.29 Acres lot
$N/A/sqft
No HOA
Neighborhood Data
Neighborhood data shown for ZIP Code: 62703, Springfield, IL area.
Housing Distribution
Housing Statistics
| Category | Value |
|---|---|
| Total HU (Housing Units) | 13,796 (100%) |
| Owner Occupied HU | 6,719 (48.7%) |
| Renter Occupied HU | 5,111 (37.0%) |
| Vacant Housing Units | 1,966 (14.3%) |
| Median Home Value | $106,497 |
| Average Home Value | $153,646 |
Housing Distribution
Address Breakdown
Residential
12,927
Single Family
11,565
Multi-Family
1,362
Businesses
1,237
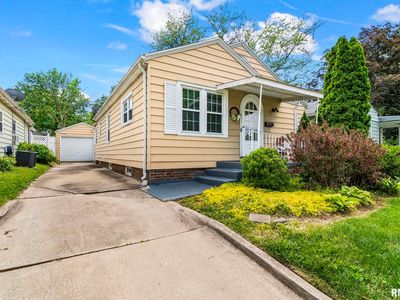
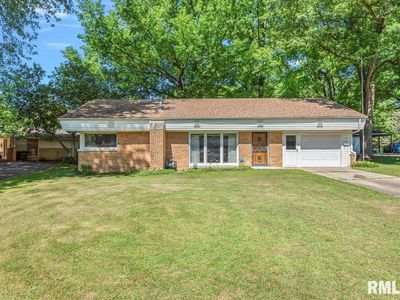
Nearby investment properties with comparable rents
Nearby investment properties with comparable prices
Listed by: N/A • N/A
Mls Name: RMLS Alliance as distributed by MLS GRID
Mls ID: #CA1043957