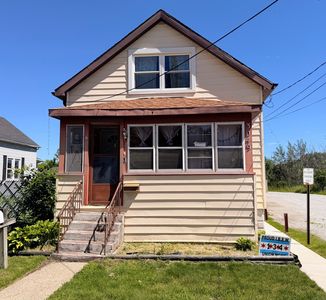
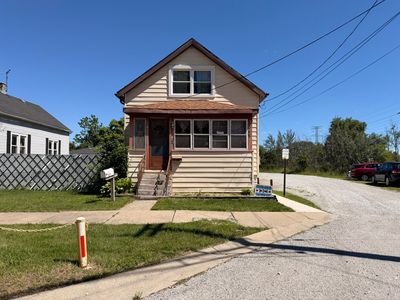
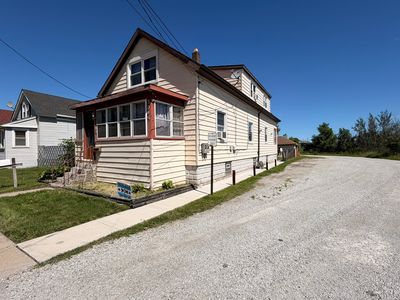
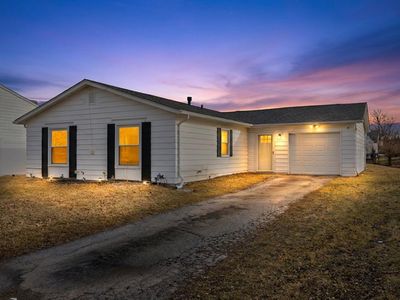
3049 E 138th PlBurnhamIL60633
INVESTMENT ANALYSIS
Investment Verdict
Strong Cash Flow3049 E 138th Pl, Burnham, IL, 60633 in Burnham earns its strong cash-flow label: 11.37% yield, $2,036/mo rent, $546/mo net income, DSCR 2.11. The $214,900 acquisition cost produces immediate returns that put this property in the top tier for U.S. income assets accessible via Ziffy Mortgage's rental-income underwriting. Long-term, 5% annual appreciation adds $59,373 by year five. Combined with $1,979/yr in principal paydown, total projected return reaches $117,332.
| This Property | National Avg | |
|---|---|---|
| Gross Rental Yield | 11.4% | 6.2% |
| Monthly Cash Flow | $546 | $180 |
National averages based on 2024–2025 U.S. residential rental market data. Content is user-generated and unverified.
DSCR Rental Loan Qualification
Qualifies using the property's rental income, not your personal income.
- ✓No W-2, pay stubs, or tax returns needed
- ✓Rental income qualifies you
- ✓Built for real estate investors
| Monthly Rental Income | $2,036 |
| Total Monthly Debt Service | $1,405 |
| DSCR Ratio | 1.45x |
Ziffy Mortgage: Your DSCR most likely meets our 1.0+ requirement, so you'll most probably qualify for our standard DSCR investment loan program. To pre-qualify, book time with your loan officer →
Estimates assume 6.0% rate / 30-yr fixed, 30% down, 1% tax, 0.5% insurance. Not a commitment to lend.
Multi Family
Built in 1909
2,613 sqft lot
$N/A/sqft
No HOA
Neighborhood Data
Neighborhood data shown for ZIP Code: 60633, Chicago, IL area.
Housing Distribution
Housing Statistics
| Category | Value |
|---|---|
| Total HU (Housing Units) | 5,328 (100%) |
| Owner Occupied HU | 3,297 (61.9%) |
| Renter Occupied HU | 1,558 (29.2%) |
| Vacant Housing Units | 473 ( 8.9%) |
| Median Home Value | $179,476 |
| Average Home Value | $222,473 |
Housing Distribution
Address Breakdown
Residential
5,013
Single Family
4,538
Multi-Family
475
Businesses
206


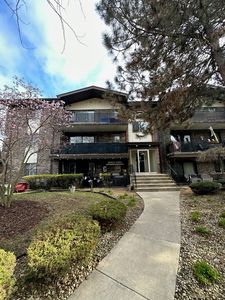
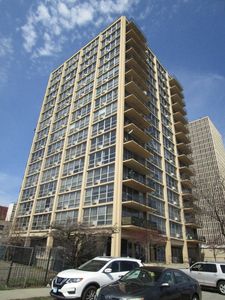
Nearby investment properties with comparable rents

Nearby investment properties with comparable prices

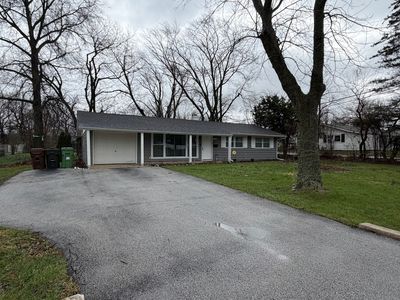
Ziffy AI Summary
A quick, investor-focused snapshot highlighting income strength, yield potential.
| Key metrics | Value |
|---|---|
| Price | $399,900 |
| Est. Rent | $3,200/mo |
| ROI | 18% |
- Attractive rent-to-price ratio for income stability
- Good fit for DSCR financing with healthy coverage
Multi Family
Built in 1909
2,613 sqft lot
$N/A/sqft
No HOA
Neighborhood Data
Neighborhood data shown for ZIP Code: 60633, Chicago, IL area.
Housing Distribution
Housing Statistics
| Category | Value |
|---|---|
| Total HU (Housing Units) | 5,328 (100%) |
| Owner Occupied HU | 3,297 (61.9%) |
| Renter Occupied HU | 1,558 (29.2%) |
| Vacant Housing Units | 473 ( 8.9%) |
| Median Home Value | $179,476 |
| Average Home Value | $222,473 |
Housing Distribution
Address Breakdown
Residential
5,013
Single Family
4,538
Multi-Family
475
Businesses
206
Nearby investment properties with comparable rents
Nearby investment properties with comparable prices