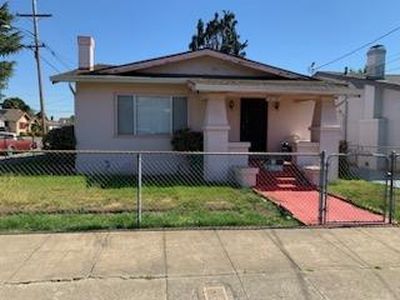
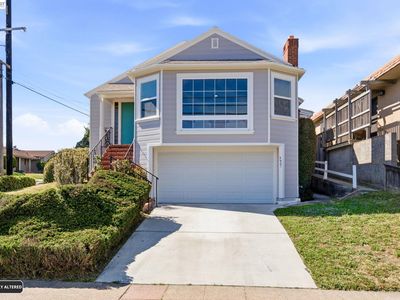
2732 60th AveOaklandCA94605
INVESTMENT ANALYSIS
Investment Verdict
Strong Cash FlowIf cash-on-cash performance is your primary filter, 2732 60th Ave, Oakland, CA, 94605 in Oakland deserves attention. This $498,800 property earns $4,386/mo in rent, a 10.55% gross yield, and nets $1,300/mo after the $2,243/mo payment. DSCR 1.96 makes it one of the cleaner DSCR underwriting candidates Ziffy Mortgage sees in this market. Five-year appreciation of $137,809 compounds alongside $4,594/yr in yearly equity build, for a total cumulative return of $272,813.
| This Property | National Avg | |
|---|---|---|
| Gross Rental Yield | 10.6% | 6.2% |
| Monthly Cash Flow | $1,300 | $180 |
National averages based on 2024–2025 U.S. residential rental market data. Content is user-generated and unverified.
DSCR Rental Loan Qualification
Qualifies using the property's rental income, not your personal income.
- ✓No W-2, pay stubs, or tax returns needed
- ✓Rental income qualifies you
- ✓Built for real estate investors
| Monthly Rental Income | $4,386 |
| Total Monthly Debt Service | $2,887 |
| DSCR Ratio | 1.52x |
Ziffy Mortgage: Your DSCR most likely meets our 1.0+ requirement, so you'll most probably qualify for our standard DSCR investment loan program. To pre-qualify, book time with your loan officer →
Estimates assume 6.0% rate / 30-yr fixed, 30% down, 1% tax, 0.5% insurance. Not a commitment to lend.
Single Family
Built in 1927
4,400 sqft lot
$N/A/sqft
No HOA
Neighborhood Data
Neighborhood data shown for ZIP Code: 94605, Oakland, CA area.
Housing Distribution
Housing Statistics
| Category | Value |
|---|---|
| Total HU (Housing Units) | 16,738 (100%) |
| Owner Occupied HU | 9,324 (55.7%) |
| Renter Occupied HU | 6,588 (39.4%) |
| Vacant Housing Units | 826 ( 4.9%) |
| Median Home Value | $928,785 |
| Average Home Value | $1,070,066 |
Housing Distribution
Address Breakdown
Residential
16,316
Single Family
13,339
Multi-Family
2,977
Businesses
674


Nearby investment properties with comparable rents
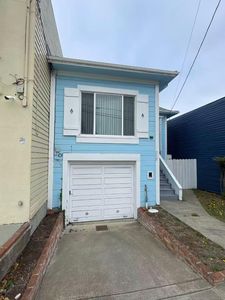

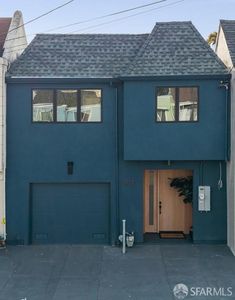
Nearby investment properties with comparable prices
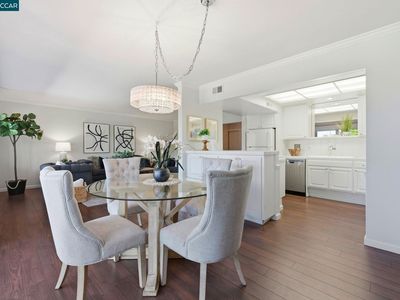

Ziffy AI Summary
A quick, investor-focused snapshot highlighting income strength, yield potential.
| Key metrics | Value |
|---|---|
| Price | $399,900 |
| Est. Rent | $3,200/mo |
| ROI | 18% |
- Attractive rent-to-price ratio for income stability
- Good fit for DSCR financing with healthy coverage
Single Family
Built in 1927
4,400 sqft lot
$N/A/sqft
No HOA
Neighborhood Data
Neighborhood data shown for ZIP Code: 94605, Oakland, CA area.
Housing Distribution
Housing Statistics
| Category | Value |
|---|---|
| Total HU (Housing Units) | 16,738 (100%) |
| Owner Occupied HU | 9,324 (55.7%) |
| Renter Occupied HU | 6,588 (39.4%) |
| Vacant Housing Units | 826 ( 4.9%) |
| Median Home Value | $928,785 |
| Average Home Value | $1,070,066 |
Housing Distribution
Address Breakdown
Residential
16,316
Single Family
13,339
Multi-Family
2,977
Businesses
674
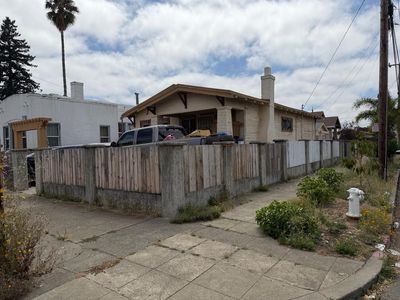
Nearby investment properties with comparable rents
Nearby investment properties with comparable prices
Listed by: N/A • N/A
Mls Name: MLSListings Inc
Mls ID: #ML82026283