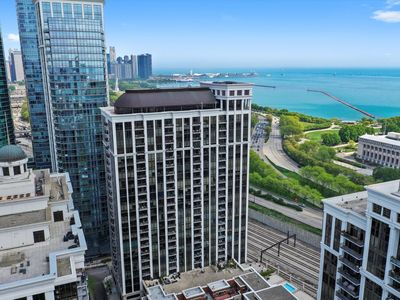
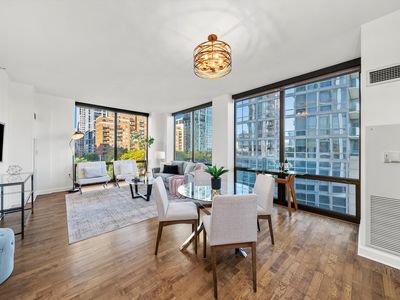
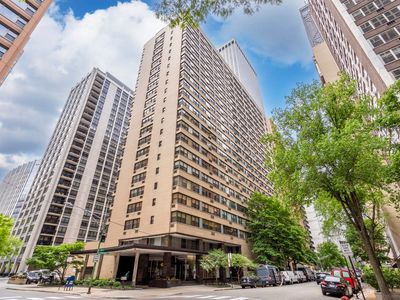
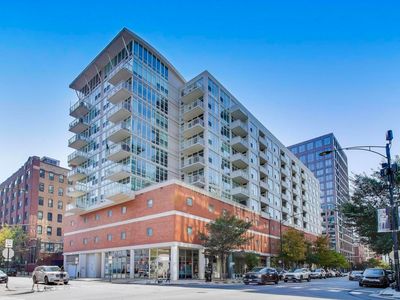
233 E 13th St APT 601ChicagoIL60605

INVESTMENT ANALYSIS
Investment Verdict
Strong Cash FlowDay-one income is the story at 233 E 13th St APT 601, Chicago, IL, 60605 in Chicago. Priced at $448,000, it generates $3,773/mo in gross rent and $665/mo in net monthly cash flow, a 10.11% yield that comfortably supports the 1.87 DSCR needed for Ziffy Mortgage's no-W2 DSCR mortgage. Projected annual cash flow: $7,985. Five-year appreciation: $123,774. Equity from principal paydown: $4,126/yr. Total projected cumulative return: $214,228.
| This Property | National Avg | |
|---|---|---|
| Gross Rental Yield | 10.1% | 6.2% |
| Monthly Cash Flow | $665 | $180 |
National averages based on 2024–2025 U.S. residential rental market data. Content is user-generated and unverified.
DSCR Rental Loan Qualification
Qualifies using the property's rental income, not your personal income.
- ✓No W-2, pay stubs, or tax returns needed
- ✓Rental income qualifies you
- ✓Built for real estate investors
| Monthly Rental Income | $3,773 |
| Total Monthly Debt Service | $2,929 |
| DSCR Ratio | 1.29x |
Ziffy Mortgage: Your DSCR most likely meets our 1.0+ requirement, so you'll most probably qualify for our standard DSCR investment loan program. To pre-qualify, book time with your loan officer →
Estimates assume 6.0% rate / 30-yr fixed, 30% down, 1% tax, 0.5% insurance. Not a commitment to lend.
Condo
Built in 2005
N/A lot
$N/A/sqft
No HOA
Neighborhood Data
Neighborhood data shown for ZIP Code: 60605, Chicago, IL area.
Housing Distribution
Housing Statistics
| Category | Value |
|---|---|
| Total HU (Housing Units) | 23,547 (100%) |
| Owner Occupied HU | 7,539 (32.0%) |
| Renter Occupied HU | 12,603 (53.5%) |
| Vacant Housing Units | 3,405 (14.5%) |
| Median Home Value | $472,201 |
| Average Home Value | $575,433 |
Housing Distribution
Address Breakdown
Residential
20,878
Single Family
1,088
Multi-Family
19,790
Businesses
960


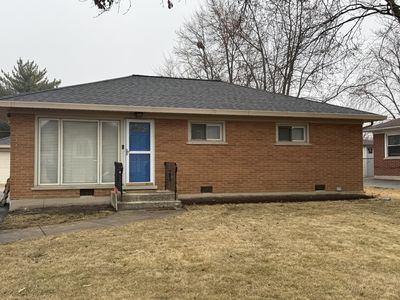
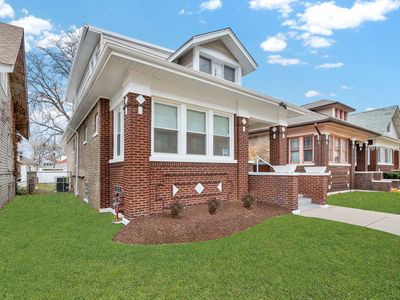
Nearby investment properties with comparable rents
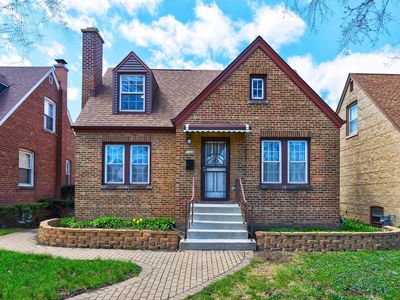
Nearby investment properties with comparable prices


Ziffy AI Summary
A quick, investor-focused snapshot highlighting income strength, yield potential.
| Key metrics | Value |
|---|---|
| Price | $399,900 |
| Est. Rent | $3,200/mo |
| ROI | 18% |
- Attractive rent-to-price ratio for income stability
- Good fit for DSCR financing with healthy coverage
Condo
Built in 2005
N/A lot
$N/A/sqft
No HOA
Neighborhood Data
Neighborhood data shown for ZIP Code: 60605, Chicago, IL area.
Housing Distribution
Housing Statistics
| Category | Value |
|---|---|
| Total HU (Housing Units) | 23,547 (100%) |
| Owner Occupied HU | 7,539 (32.0%) |
| Renter Occupied HU | 12,603 (53.5%) |
| Vacant Housing Units | 3,405 (14.5%) |
| Median Home Value | $472,201 |
| Average Home Value | $575,433 |
Housing Distribution
Address Breakdown
Residential
20,878
Single Family
1,088
Multi-Family
19,790
Businesses
960
Nearby investment properties with comparable rents
Nearby investment properties with comparable prices